

A model reported Skipped or Not Supported was never requested, so the logs hold no
entry for it. Sync status settles both.
Where to find them
Open Logs in the dashboard for the whole account, or open a single connector to scope it to that customer. Scoping to the connector is faster.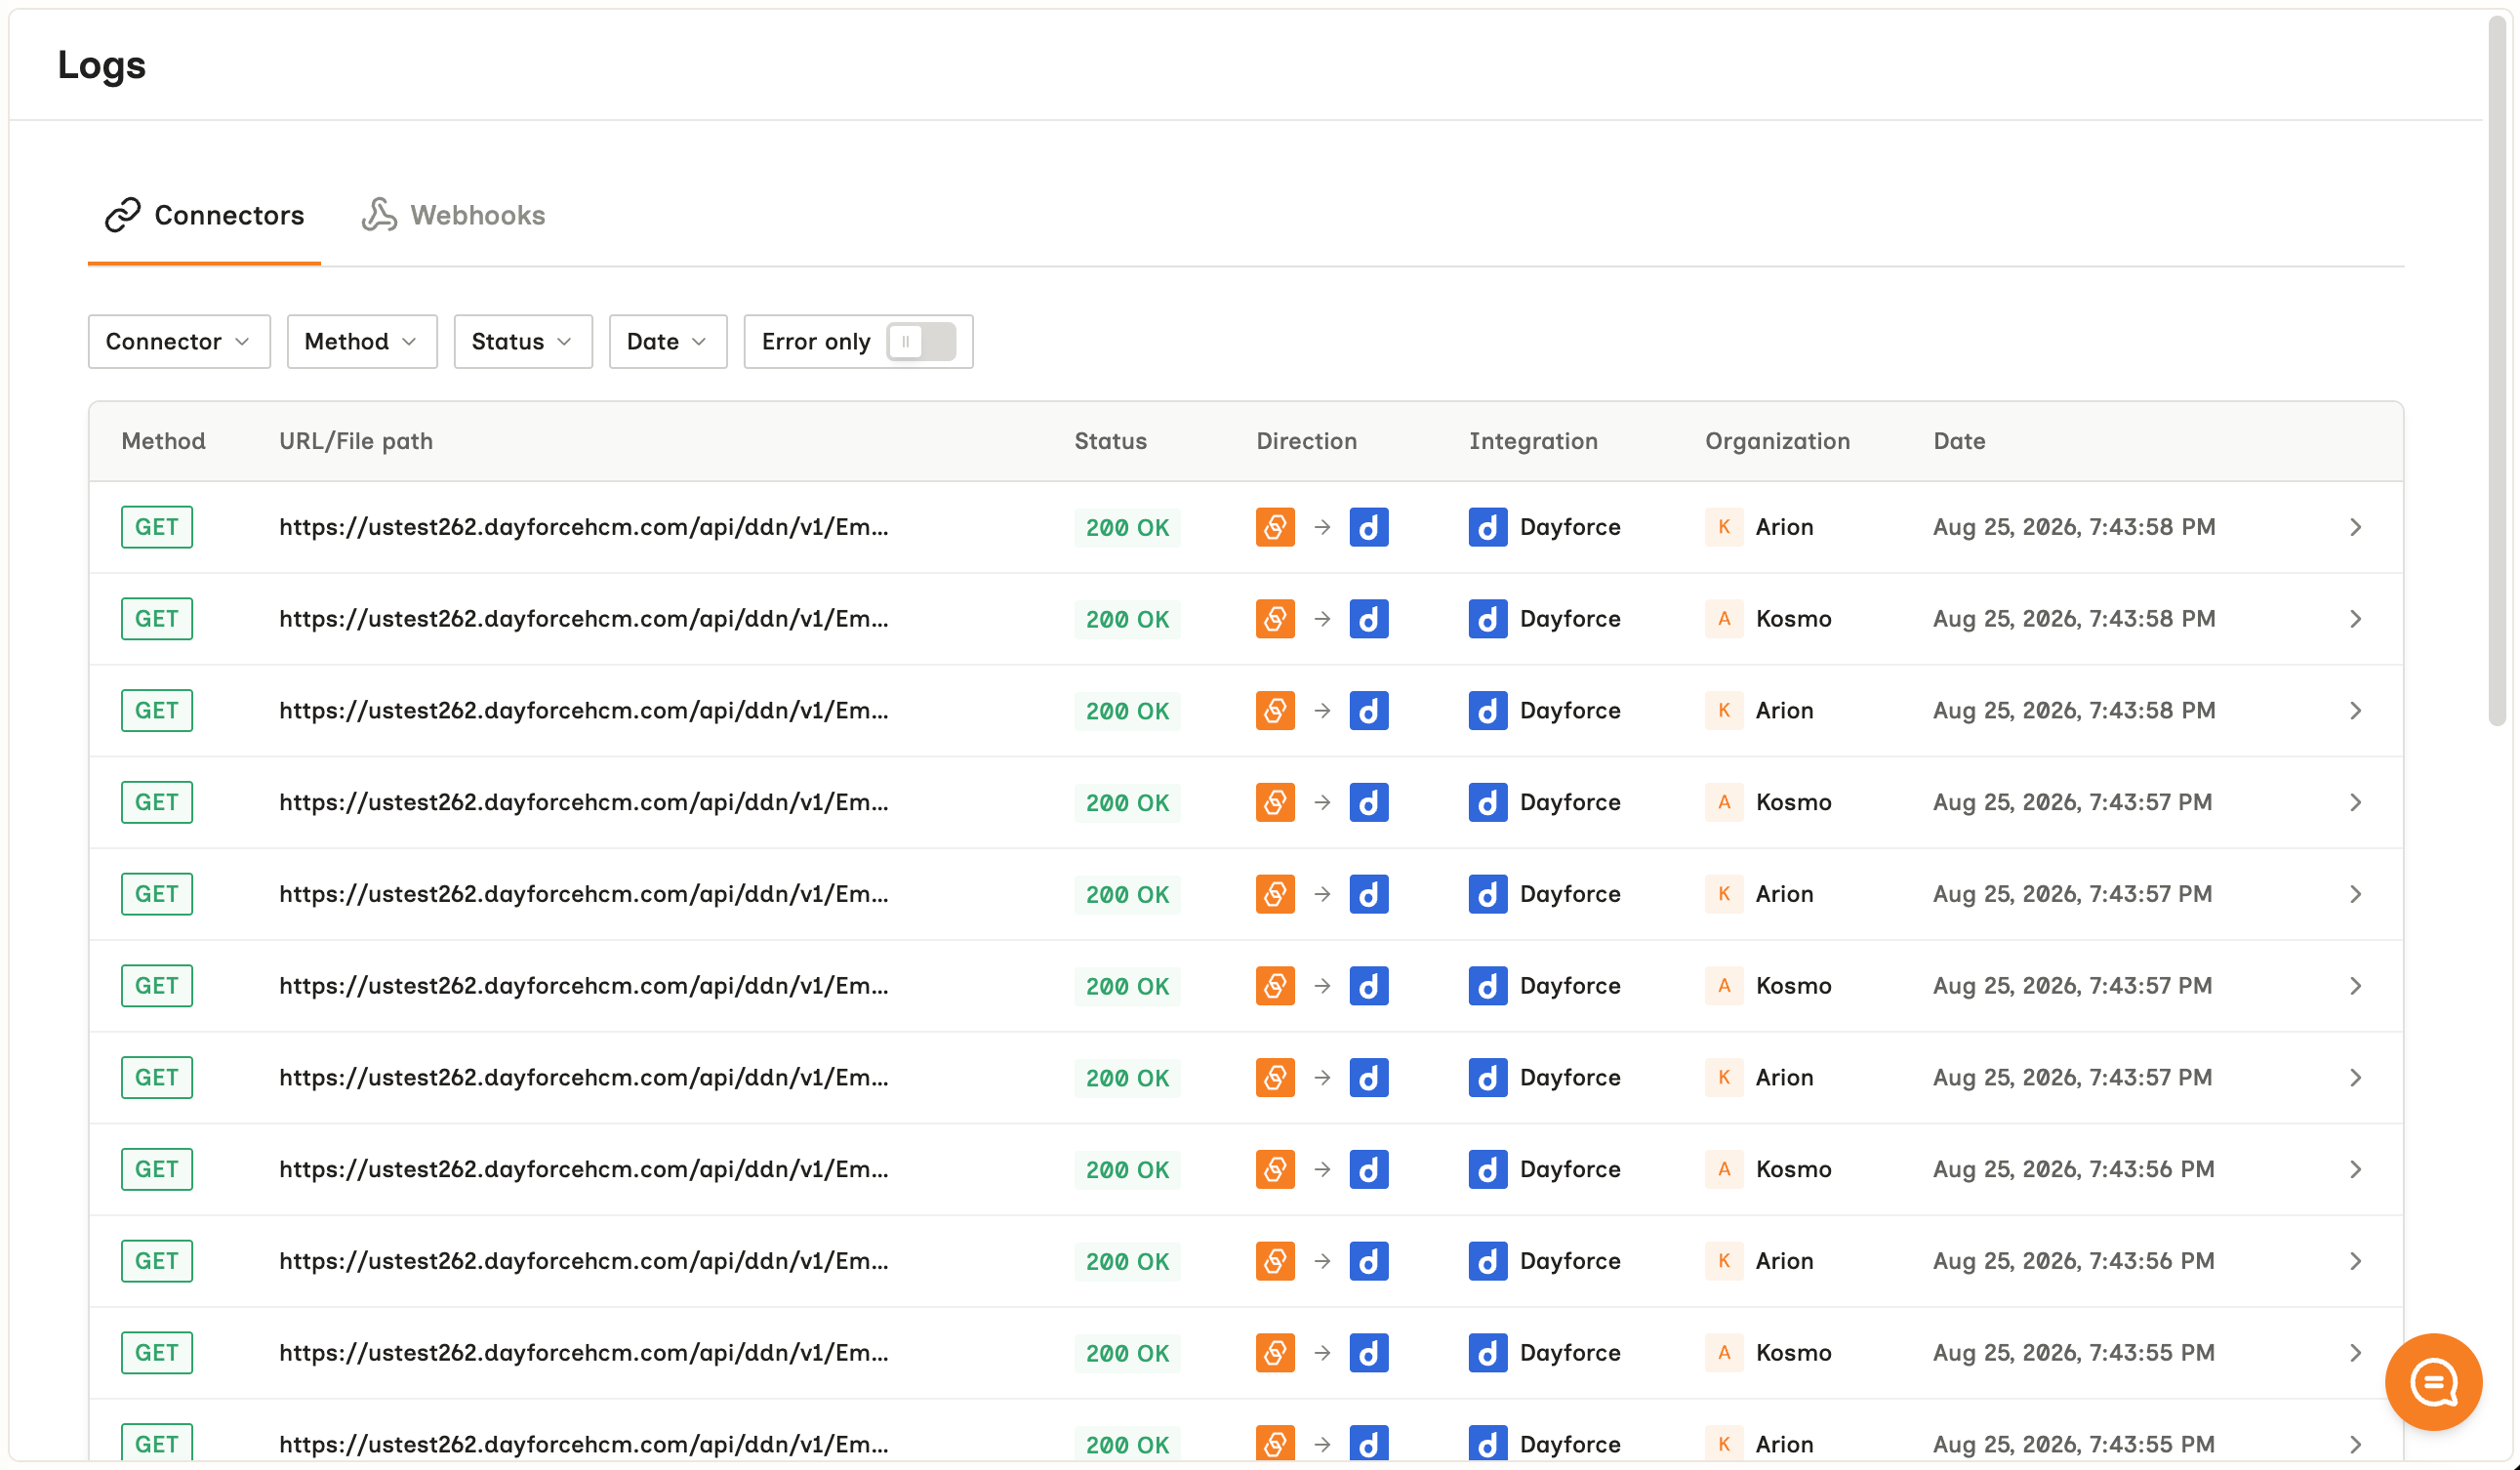
What an entry holds
Find an answer
Connector logs are dashboard-only
There is no API for them. Anything your own monitoring acts on has to come from sync webhooks or the connector’sstatus and sync_status fields.
Webhook delivery logs are separate
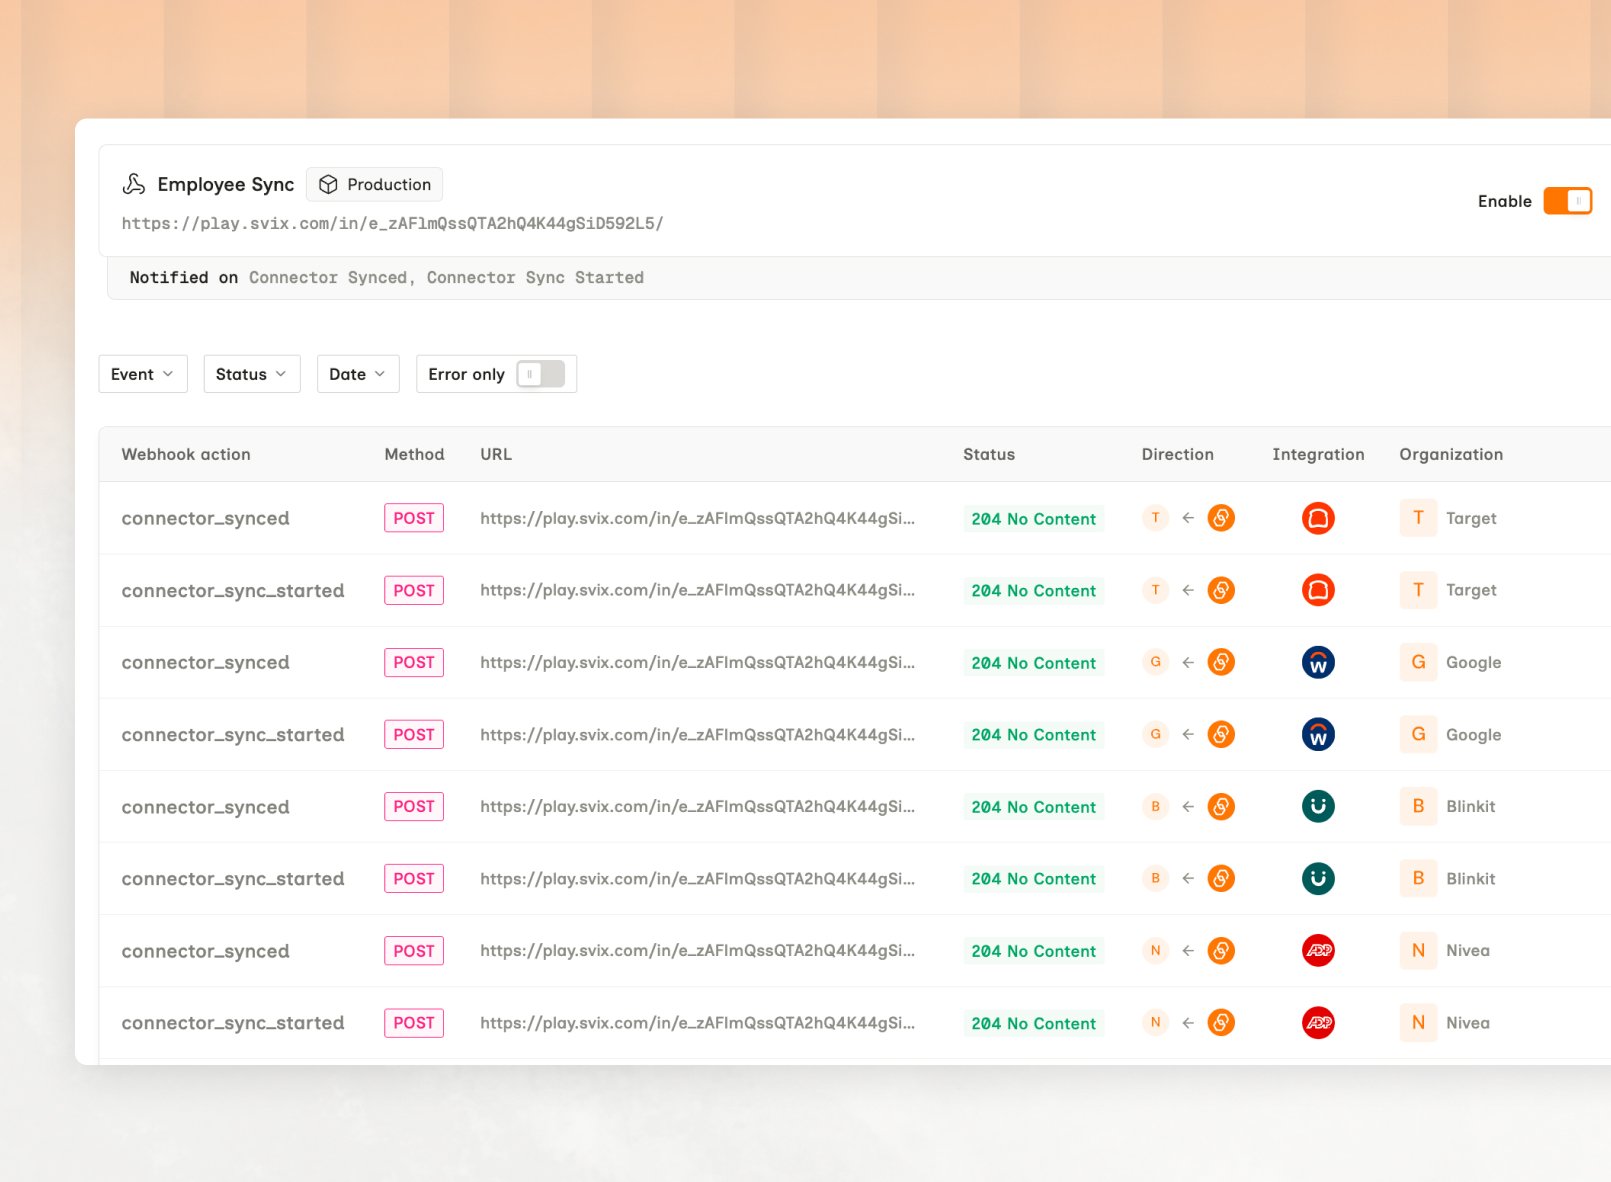
They record Bindbee’s attempts to reach your endpoint, so they answer why your handler stayed quiet. Those do have an API: List Webhook Logs, and the dashboard keeps them on the Webhooks tab under Logs. Eachresponse_code is explained on Delivery and retries.
Limits
- An empty field. A
200with the field absent leaves no error to find. That’s scope, permissions, or the unified model - see Scoping. - An upstream deletion. A record disappearing produces no request, so no entry.
- Retention. The window is unpublished, so treat logs as a recent-debugging tool rather than an audit trail.
Related
- Troubleshooting overview - where this page sits in the flow
- Sync status - the first check, and the one that resolves most cases
- Errors - differentiating a Bindbee failure from an origin-system one